Date: 05-05-2025
How Gender, Education, and Seniority Shape Pay in the Workplace
A data science project analysing complex relationships between different factor and salary pay
Read more
Date: 15-01-2024
This is a binary classification model to determine whether a customer application for a credit card should be approved or rejected. The result shows accuracy score of 76.12% and F1 score of 86.11% for the logistic regression model.
In this classification model, my plan is to:
- Observe the Weight of Evidence (WoE) and the Information Value (IV) of the features
- Use Synthetic Minority Oversampling Technique (SMOTE) to overcome class imbalance in the dataset
- Apply different algorithms to the training dataset.

Date: 24-09-2023
A price prediction model of a diamond based on its carat, depth, table and dimension using Random Forest. This model achieves .98 accuracy based on its R-squared score!
This dataset was imported from kaggle. There are 53,940 diamonds in the dataset with 10 features (carat, cut, color, clarity, depth, table, price, x, y, and z). Most variables are numeric in nature, but the variables cut, color, and clarity are ordered factor variables.
Read more
Date: 28-07-2023
A sentiment polarity analysis of airline reviews using VADER (Valence Aware Dictionary and sEntiment Reasoner) lexicon by NLTK. VADER lexicon is a rule-based sentiment analyzer in which the terms are generally labeled as per their semantic orientation as either positive or negative.
This airline reviews dataset contains 23,171 reviews for 497 airlines and was imported from kaggle. It was collected by web scraping the website https://www.airlinequality.com/ using the Python library Beautiful Soup. The website serves as a platform for travelers to submit their reviews and ratings about different airlines.
Read more
Date: 12-06-2023
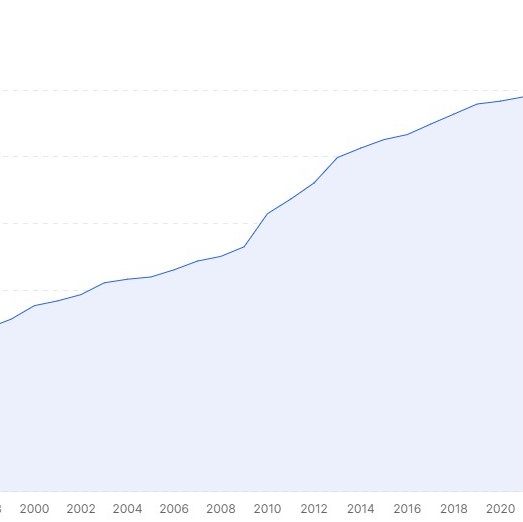
A simple linear regression model using Scikit-Learn to predict the annual labour size in Malaysia. I found this model is suitable for this dataset as the actual data is already considerably linear.
This dataset was imported from OpenDOSM, an open-sourced website by Department of Statistics Malaysia. It is based on The Labour Force Survey (LFS) from the year 1982 to 2021. However, there is no data for 1991 and 1994 because the LFS was not conducted in those years. The sum of each category may not always equal to the totals shown in related tables because of independent rounding to one decimal place.
View Source Code
Date: 10-06-2023
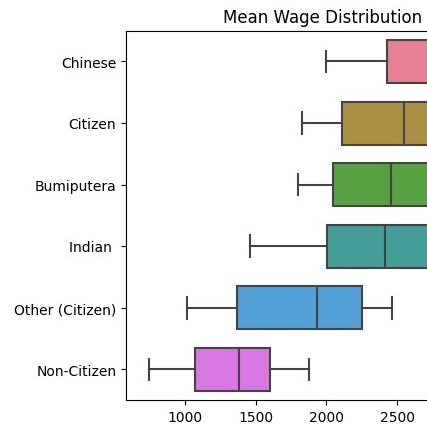
This is another Exploratory Data Analysis (EDA) on income distribution in Malaysia to look further into comparison by different categories. I used matplotlib and seaborn to visualise the mean income by different education level, gender, ethnicity and industry.
This dataset was imported from OpenDOSM, an open-sourced website by Department of Statistics Malaysia. It is based on The Salaries & Wages Survey, which collects data via a stratified two-stage sample design, thus obtaining representative data at the national and state level. The implementation of this survey is based on guidelines and recommendations of the International Labour Organization (ILO) with reference to An Integrated System of Wages Statistics.
View Source Code
Date: 02-06-2023
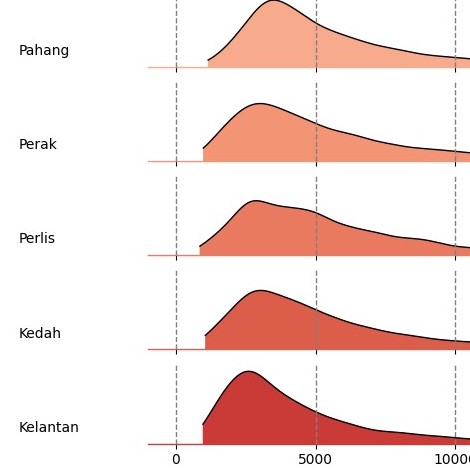
Inspired by a tweet from Thevesh, a data scientist in Central Bank of Malaysia. I tried to replicate the ridge plot and other data visualization using Seaborn.
This dataset was imported from OpenDOSM, an open-sourced website by Department of Statistics Malaysia. It is based on Household Income Surveys (HIS) and Household Income & Expenditure Surveys (HIES) carried out from 1970 to 2022, the latest of which is HIES 2022.
View Source Code
Date: 13-05-2023
This is an Exploratory Data Analysis and simple visualization for video games sales by genre, platform and region.
This dataset contains a list of video games with sales greater than 100,000 copies from the year 1980 to 2016. It was generated by a scrape of vgchartz.com.
View Source Code